CAEP Annual Report - pg. 2
Measure 2: Satisfaction of Employers and Stakeholder Involvement
CAEP Component R4.2|R5.3
North Carolina Department of Public Instruction Employer Survey Data: WSSU
The North Carolina Department of Public Instruction distributes the Employer Survey annually to supervisors of first-year teachers in North Carolina public schools. The survey contains 21 items designed to measure the supervisor’s sense of how well their teachers are prepared. The beginning prompt for the items is: “Relative to other first year teachers, how effective was this teacher on the following tasks……”. Supervisors respond with one of five possible responses: 1=Much less effective, 2=Less effective, 3=Comparable, 4=More effective, and 5=Much more effective. Data is summarized as the percentage of teachers scored at each of the 5 ratings levels.
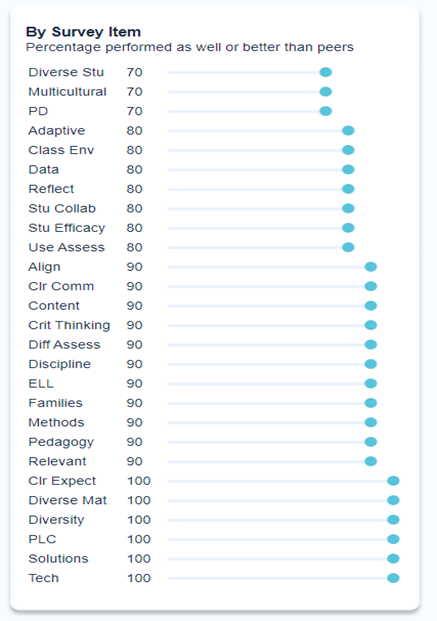
The North Carolina Department of Public Instruction administers the Annual Employer Survey. On the survey, employers of recent graduates rated the performance of specified teaching tasks as compared to other recent graduates. Possible ratings of effectiveness were not applicable, much less, less, comparable, and more and much more effective. The results below summarize (13) responses for 2025.
Overall employer satisfaction was measured as the percentage of teaching tasks on which WSSU prepared teachers performed as well as or better than the average first-year teacher. WSSU graduates performed as well or better than the average first-year teacher on 92% of the response items. The table below shows the percentage of teachers who performed as well as or better than the average first-year teacher on the individual teaching tasks included in the survey. Further disaggregation of data was not performed due to the small sample size.
Source: North Carolina Department of Public Instruction ( Spring 2025). NCDPI Educator Preparation Program Dashboard.
|
Teaching Practice |
% Performed as well or better than peers |
|
Adapting teaching to benefit students with unique learning needs |
100% |
|
Aligning instruction with the North Carolina Standard Course of Study |
100% |
|
Assessing students' literacy development |
100% |
|
Communicating in ways that are clearly understood by students |
100% |
|
Contributing to the productivity of school wide goals |
100% |
|
Demonstrating pedagogical competency |
100% |
|
Demonstrating skill in support of English second language learners |
100% |
|
Developing students' foundational reading skills (e.g. phonemic awareness, phonological awareness, phonics) |
100% |
|
Developing students' reading comprehension |
100% |
|
Developing students' reading fluency |
100% |
|
Developing students' vocabulary |
100% |
|
Differentiating literacy instruction to meet the needs of diverse learners |
100% |
|
Engaging in professional development to address identified improvement needs |
100% |
|
Exhibiting a strong foundation of knowledge in his/her content area(s) |
86% |
|
Facilitating learning through student collaboration in small groups and teams |
86% |
|
Helping students believe they can do well in school |
100% |
|
Helping students value learning |
100% |
|
Implementing culturally responsive pedagogy in literacy instruction |
100% |
|
Incorporating instructional materials that reflect a diverse set of student experiences |
100% |
|
Integrating technology into instruction to enhance learning |
100% |
|
Investing families and other significant adults in students' learning |
86% |
|
Leveraging a variety of formal and informal assessments to drive student learning |
71% |
|
Maintaining a classroom environment that enables students to learn |
100% |
|
Making expectations about student behavior clear |
100% |
|
Making instruction relevant to 21st century students |
100% |
|
Managing disruptive behavior in the classroom |
100% |
|
Promoting critical thinking in students |
100% |
|
Reflecting on practice and identifying areas for improvement |
86% |
|
Respecting diversity and multiple perspectives of students |
100% |
|
Seeking solutions to address students' learning needs in a proactive manner |
100% |
|
Serving students from diverse economic backgrounds |
100% |
|
Taking an active role in professional learning communities |
100% |
|
Teaching in a multicultural or multilingual setting |
100% |
|
Using data to guide practice |
71% |
|
Using state and/or district mandated assessments to inform instruction |
100% |
|
Utilizing a variety of appropriate instructional materials |
86% |
The North Carolina Department of Public Instruction administers the Annual Employer Survey. On the survey, employers of recent graduates rated the performance of specified teaching tasks as compared to other recent graduates. Possible ratings of effectiveness were not applicable, much less, less, comparable, and more and much more effective. The results below summarize (13) responses for 2022.
Overall employer satisfaction was measured as the percentage of teaching tasks on which WSSU prepared teachers performed as well as or better than the average first-year teacher. WSSU graduates performed as well or better than the average first year teacher on 92% of the response items. The table below displays the percentage of teachers that performed as well or better than the average first year teacher on the individual teaching tasks included on the survey. Further disaggregation of data was not performed due to the small sample size.
Source: North Carolina Department of Public Instruction. (2024, June 10). NCDPI Educator Preparation Program Dashboard.
|
Teaching Practice |
% Performed as well or better than peers |
|
Adapting teaching to benefit students with unique learning needs |
82% |
|
Aligning instruction with the North Carolina Standard Course of Study |
98% |
|
Assessing students' literacy development |
93% |
|
Communicating in ways that are clearly understood by students |
91% |
|
Contributing to the productivity of school wide goals |
89% |
|
Demonstrating pedagogical competency |
89% |
|
Demonstrating skill in support of English second language learners |
91% |
|
Developing students' foundational reading skills (e.g. phonemic awareness, phonological awareness, phonics) |
93% |
|
Developing students' reading comprehension |
100% |
|
Developing students' reading fluency |
100% |
|
Developing students' vocabulary |
100% |
|
Differentiating literacy instruction to meet the needs of diverse learners |
80% |
|
Engaging in professional development to address identified improvement needs |
98% |
|
Exhibiting a strong foundation of knowledge in his/her content area(s) |
89% |
|
Facilitating learning through student collaboration in small groups and teams |
87% |
|
Helping students believe they can do well in school |
98% |
|
Helping students value learning |
93% |
|
Implementing culturally responsive pedagogy in literacy instruction |
87% |
|
Incorporating instructional materials that reflect a diverse set of student experiences |
91% |
|
Integrating technology into instruction to enhance learning |
98% |
|
Investing families and other significant adults in students' learning |
89% |
|
Leveraging a variety of formal and informal assessments to drive student learning |
87% |
|
Maintaining a classroom environment that enables students to learn |
89% |
|
Making expectations about student behavior clear |
84% |
|
Making instruction relevant to 21st century students |
93% |
|
Managing disruptive behavior in the classroom |
87% |
|
Promoting critical thinking in students |
87% |
|
Reflecting on practice and identifying areas for improvement |
91% |
|
Respecting diversity and multiple perspectives of students |
91% |
|
Seeking solutions to address students' learning needs in a proactive manner |
91% |
|
Serving students from diverse economic backgrounds |
98% |
|
Taking an active role in professional learning communities |
89% |
|
Teaching in a multicultural or multilingual setting |
98% |
|
Using data to guide practice |
89% |
|
Using state and/or district mandated assessments to inform instruction |
93% |
|
Utilizing a variety of appropriate instructional materials |
91% |
Effectiveness Rating Scale: Much Less, Less, Comparable, More, Much More.
The North Carolina Department of Public Instruction administers the Annual Employer Survey. On the survey, employers of recent graduates rated the performance of specified teaching tasks as compared to other recent graduates. Possible ratings of effectiveness were not applicable, much less, less, comparable, and more and much more effective. The results below summarize (10) responses for 2022. The survey response rate was 56%.
Overall employer satisfaction was measured as the percentage of teaching tasks on which WSSU prepared teachers performed as well as or better than the average first-year teacher. WSSU graduates performed as well or better than the average first year teacher on 87% of the response items. The figure below displays the percentage of teachers that performed as well or better than the average first year teacher on the individual teaching tasks included on the survey. Further disaggregation of data was not performed due to the small sample size.
- Respondent Percentage Agreeing WSSU Teachers Performed As Well or Better Than Other First Year Teachers.
Source: North Carolina Department of Public Instruction. (2022, June 30). NCDPI Educator Preparation Program Dashboard.
Results are shown below for the survey results for the 2020-2021 academic year. (Response rate for employers of WSSU teachers is 15%.)
|
RATING |
MUCH LESS |
LESS |
COMPARABLE |
MORE |
MUCH MORE |
N |
|---|---|---|---|---|---|---|
|
WSSU |
0% |
7% |
56% |
31% |
6% |
20 |
|
State |
1% |
7% |
49% |
29% |
14% |
5954 |
Data not provided due to COVID-19 related evaluation policy modifications.
|
Mean Standard 1 Items |
Mean Standard 2 Items |
Mean Standard 3 Items |
Mean Standard 4 Items |
Mean Standard 5 Items |
Overall Mean |
|---|---|---|---|---|---|
|
3.30 |
3.20 |
3.20 |
3.26 |
3.27 |
3.24 |
NOTE: Values are not reported if there are less than 10 teachers from a given institution
|
Mean Standard 1 Items |
Mean Standard 2 Items |
Mean Standard 3 Items |
Mean Standard 4 Items |
Mean Standard 5 Items |
Overall Mean |
|---|---|---|---|---|---|
|
3.32 |
3.23 |
3.21 |
3.24 |
3.23 |
3.25 |
NOTE: Values are not reported if there are less than 10 teachers from a given institution
Number of responses less than 10 for report year. Data not reported.
WSSU Educator Preparation Program Employer Survey Data
The WSSU Employer Survey solicits feedback from principals of North Carolina public schools employing WSSU graduates. The survey, administered every two years, solicits principals’ perceptions of graduates’ ability to demonstrate pedagogical knowledge and skills and teacher dispositions expected of teachers prepared at WSSU. The survey contains 22 Likert items assessing graduates’ perceptions of their preparation, an assessment of overall satisfaction with preparation, and various other items soliciting information on their participation in leadership of school-based activities. The 22 Likert items are aligned to the InTASC Model Core Teaching Standards.
- Overall Satisfaction
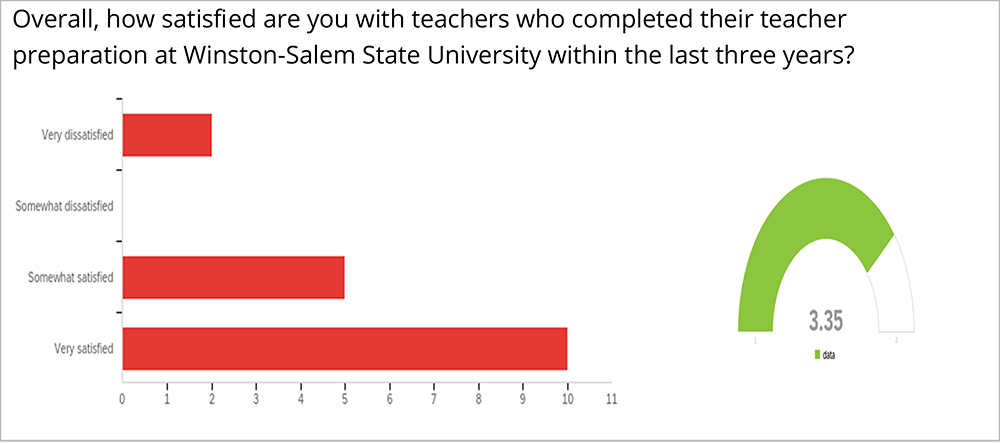
The figure below presents employing principals’ overall satisfaction with the performance of new teachers prepared in the Educator Preparation Program at WSSU. The average satisfaction rating is 3.35 out of a maximum possible rating of 4.0. The target minimum satisfaction value is 3.0. Overall, 15 of the 17 respondents (88%) indicated satisfaction with new teacher performance.
WSSU Employer Survey Overall Satisfaction Distribution and Average Score (CAEP R4.3)
- Averages of Scores for Employer Satisfaction Survey Prompts
Twenty-two (22) Likert items assessed employers’ perception of the ability of WSSU graduates to demonstrate knowledge, skills, and dispositions expected of teachers prepared at WSSU. The response items were aligned to the InTASC Standards, and scores for the aligned items were averaged to obtain an average score for the standard. The table below presents the average overall score of the items aligned to each of the standards. The desired minimum average rating is 3.0 which indicates agreement that teachers exhibit the expected knowledge, skills, or dispositions indicated in the survey prompts.
| InTASC Standard Addressed | CAEP Standard Addressed | Number of Survey Prompts | Average Score for Indicators |
|---|---|---|---|
| InTASC Standard 1 Learner Development | R1.1 | 2 | 3.36 |
| InTASC Standard 2 Learning Differences | R1.1 | 2 | 3.06 |
| InTASC Standard 3 Learning Environments | R1.1 | 5 | 3.05 |
| InTASC Standard 4 Content Knowledge | R1.2 | 5 | 2.90 |
| InTASC Standard 5 Application of Content | R1.2 | 3 | 2.69 |
| InTASC Standard 6 Assessment | R1.3 | 4 | 2.79 |
| InTASC Standard 7 Planning for Instruction | R1.3 | 3 | 2.88 |
| InTASC Standard 8 Instructional Strategies | R1.3 | 7 | 2.84 |
| InTASC Standard 9 Professional Learning and Ethical Practice | R1.4 | 1 | 3.18 |
| InTASC Standard 10 Leadership and Collaboration | R1.4 | 3 | 2.98 |